2. Managing the System
5 minute read
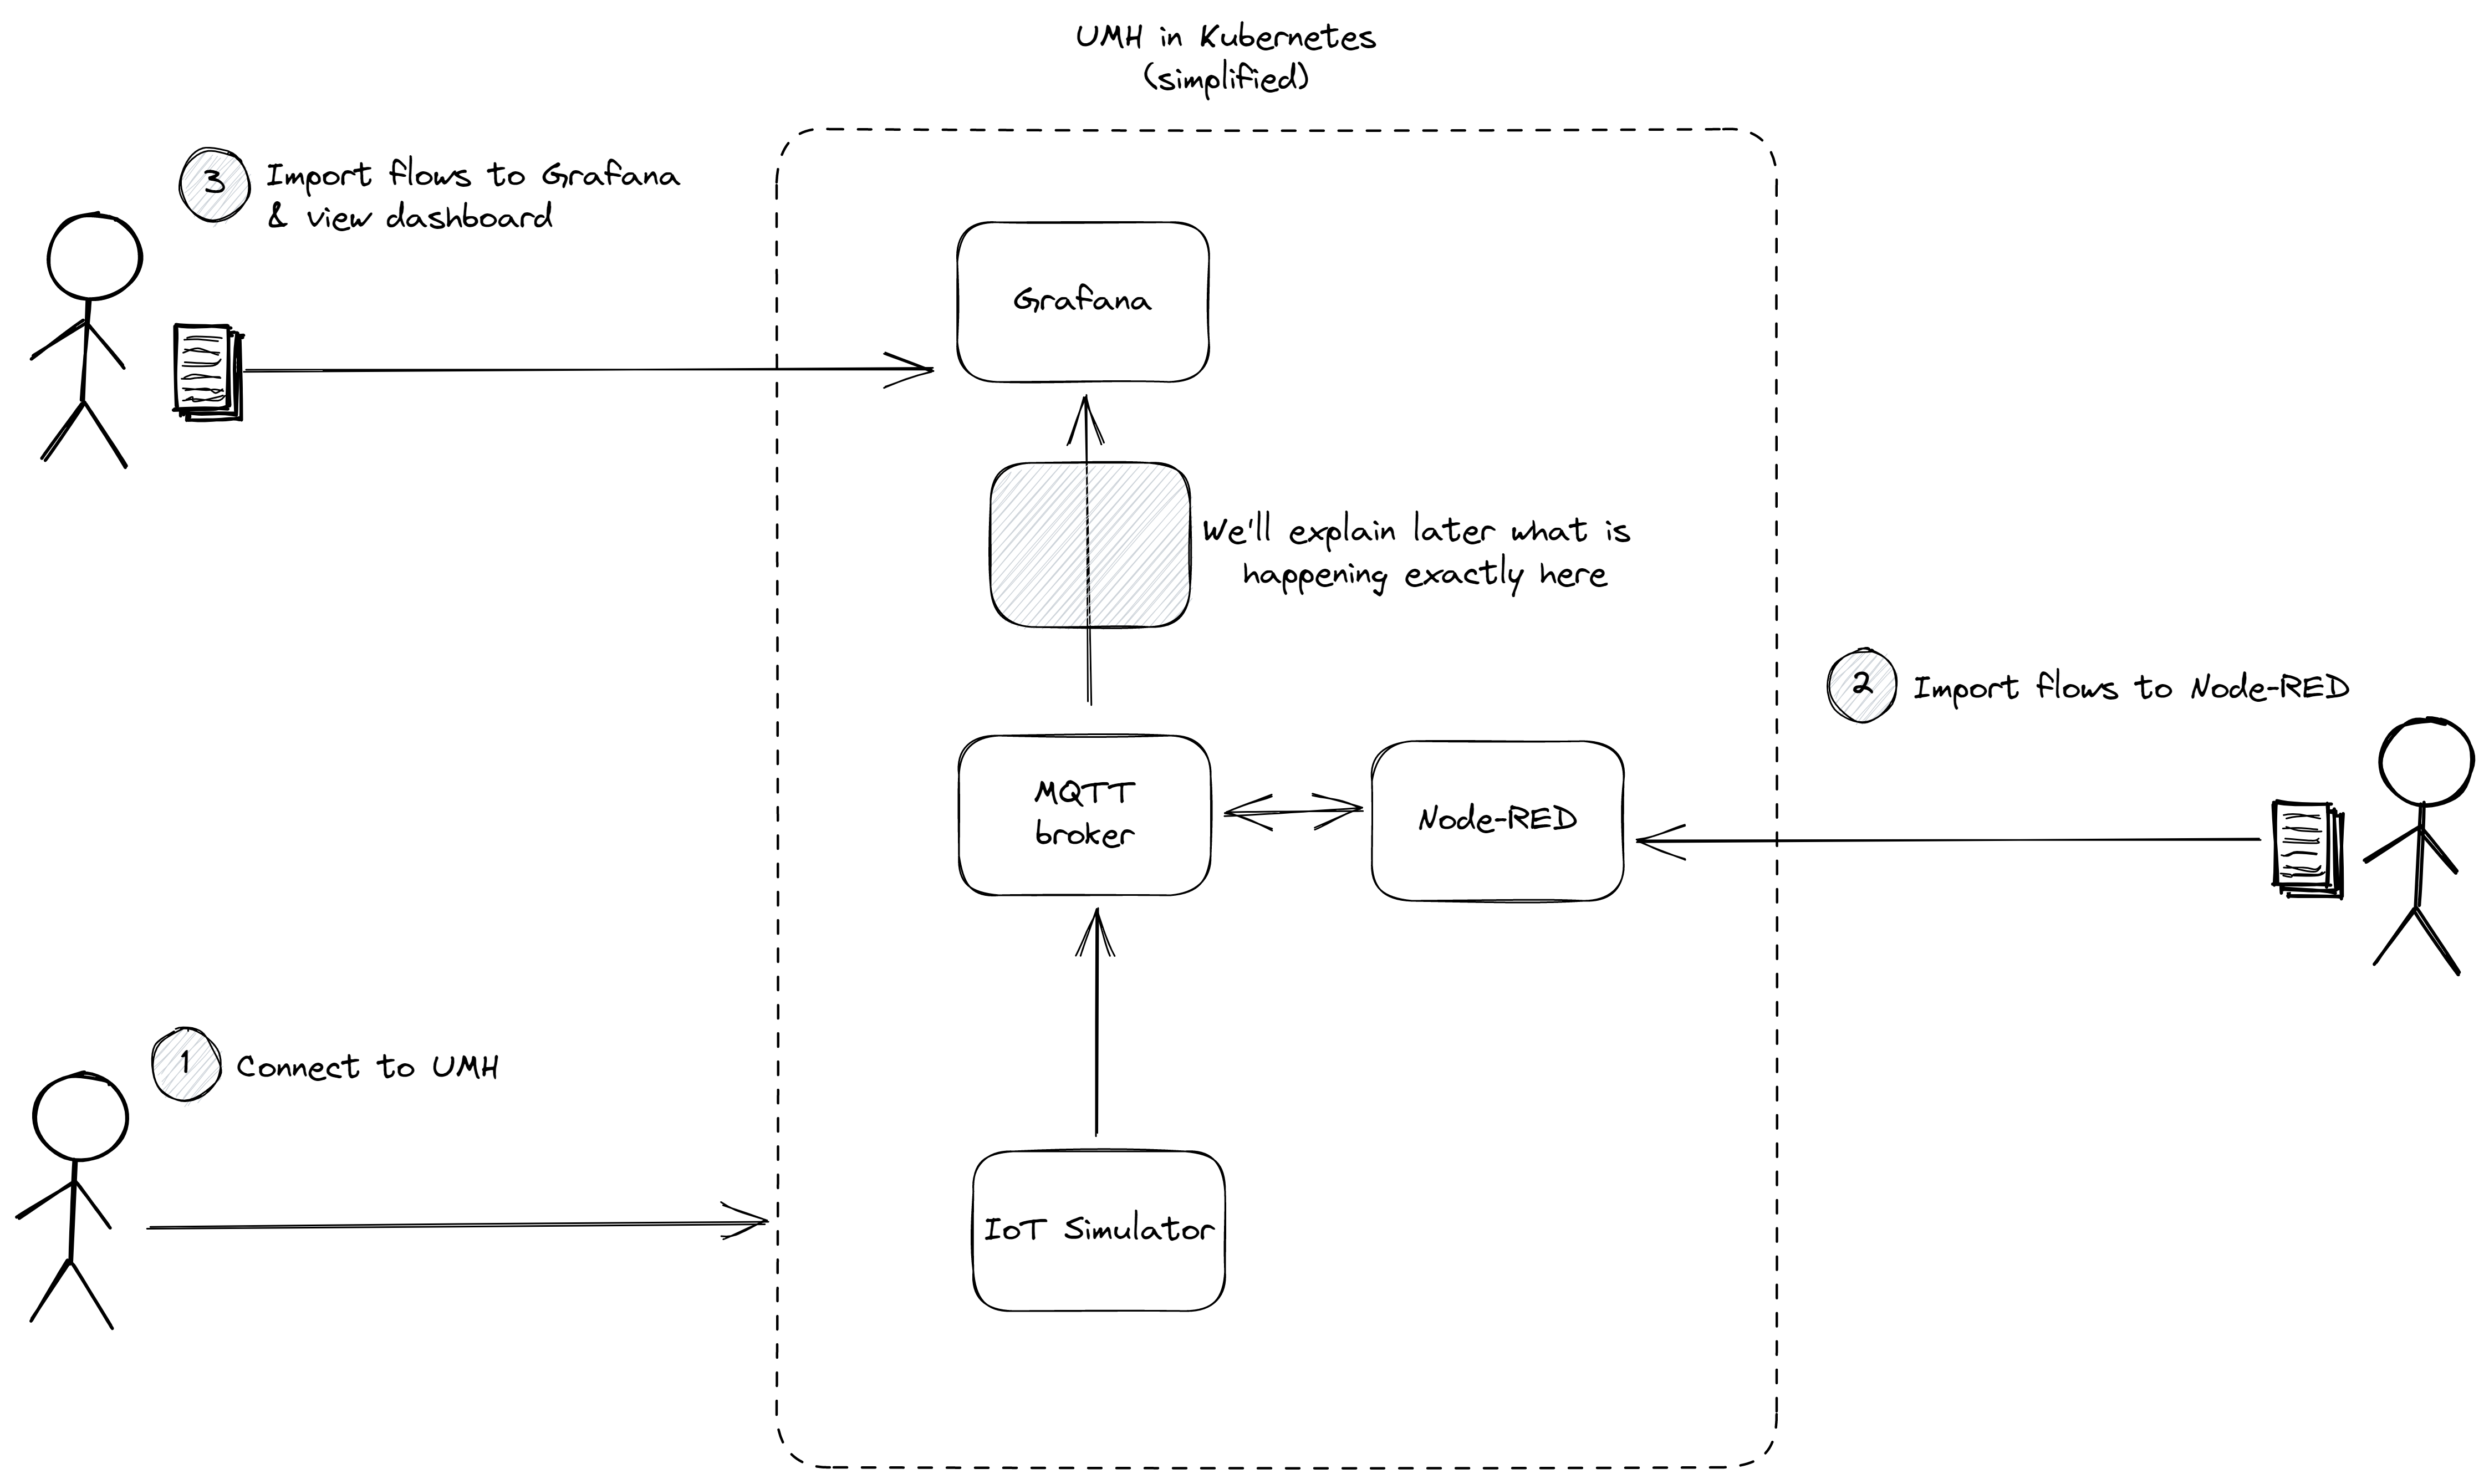
In this chapter, we will guide you through the installation of the Management Console and your first local instance of the UMH. We will also explain how the basic components work together, by creating a first Node-RED flow and a Grafana dashboard. Check out the image below for an overview:
The United Manufacturing Hub is a collection of microservices, which work together, to provide a complete solution for your manufacturing needs. From data collection to contextualization and visualization, or data storage. For rare cases that require a special feature, you can add it to your UMH stack by creating your own custom microservice.
1. Install the UMH
Download and install Docker Desktop for your operating system. This is only necessary for local installations.
Follow the tutorial in the Management Console to create your first local instance of the United Manufacturing Hub. Once the installation is finished, press the blue Finish button the right bottom corner of the Console.
A local installation functions similar to an installation on an external device, like an edge device or a VM. The benefit is, that you can easily set it up without any additional hardware and learn how to use it with simulated data.
- After creating your local instance of the UMH, you will be able to access the local installation by clicking on the tile. Open the device overview, where you can see every microservice of the stack and access and configure them. While the components of the UMH stack are installed and starting, the icons of the services will be red or white. Once the microservices look like in the picture, you can continue.
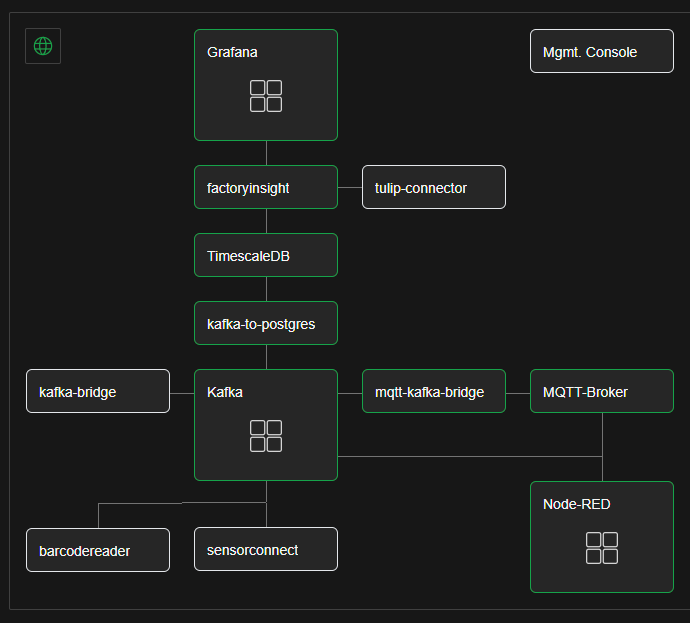
If you have a decent device, you should not be waiting longer then 5 minutes. On a slower computer, the start of your stack can take up to 15 minutes.
If the icons are still not green after 15 minutes, the installation might have failed. Go back to the overview by clicking on the arrow in the top left corner and click on the + Add Device button in the top right corner. Then you can follow the same steps as you did before to create a new local instance. You will overwrite the old local installation on your device.
- If you have no experience with Node-RED or Grafana, we recommend to follow the tutorial below. If you are already familiar with Node-RED and Grafana, you can skip the tutorial below and continue with the next part of this guide, Data Acquisition and Manipulation, to learn about the UMH data model.
2. Import flows to Node-RED
- Open Node-RED by click on the tile in the device overview, then click on the open button. You will be redirected to the web interface of Node-RED.
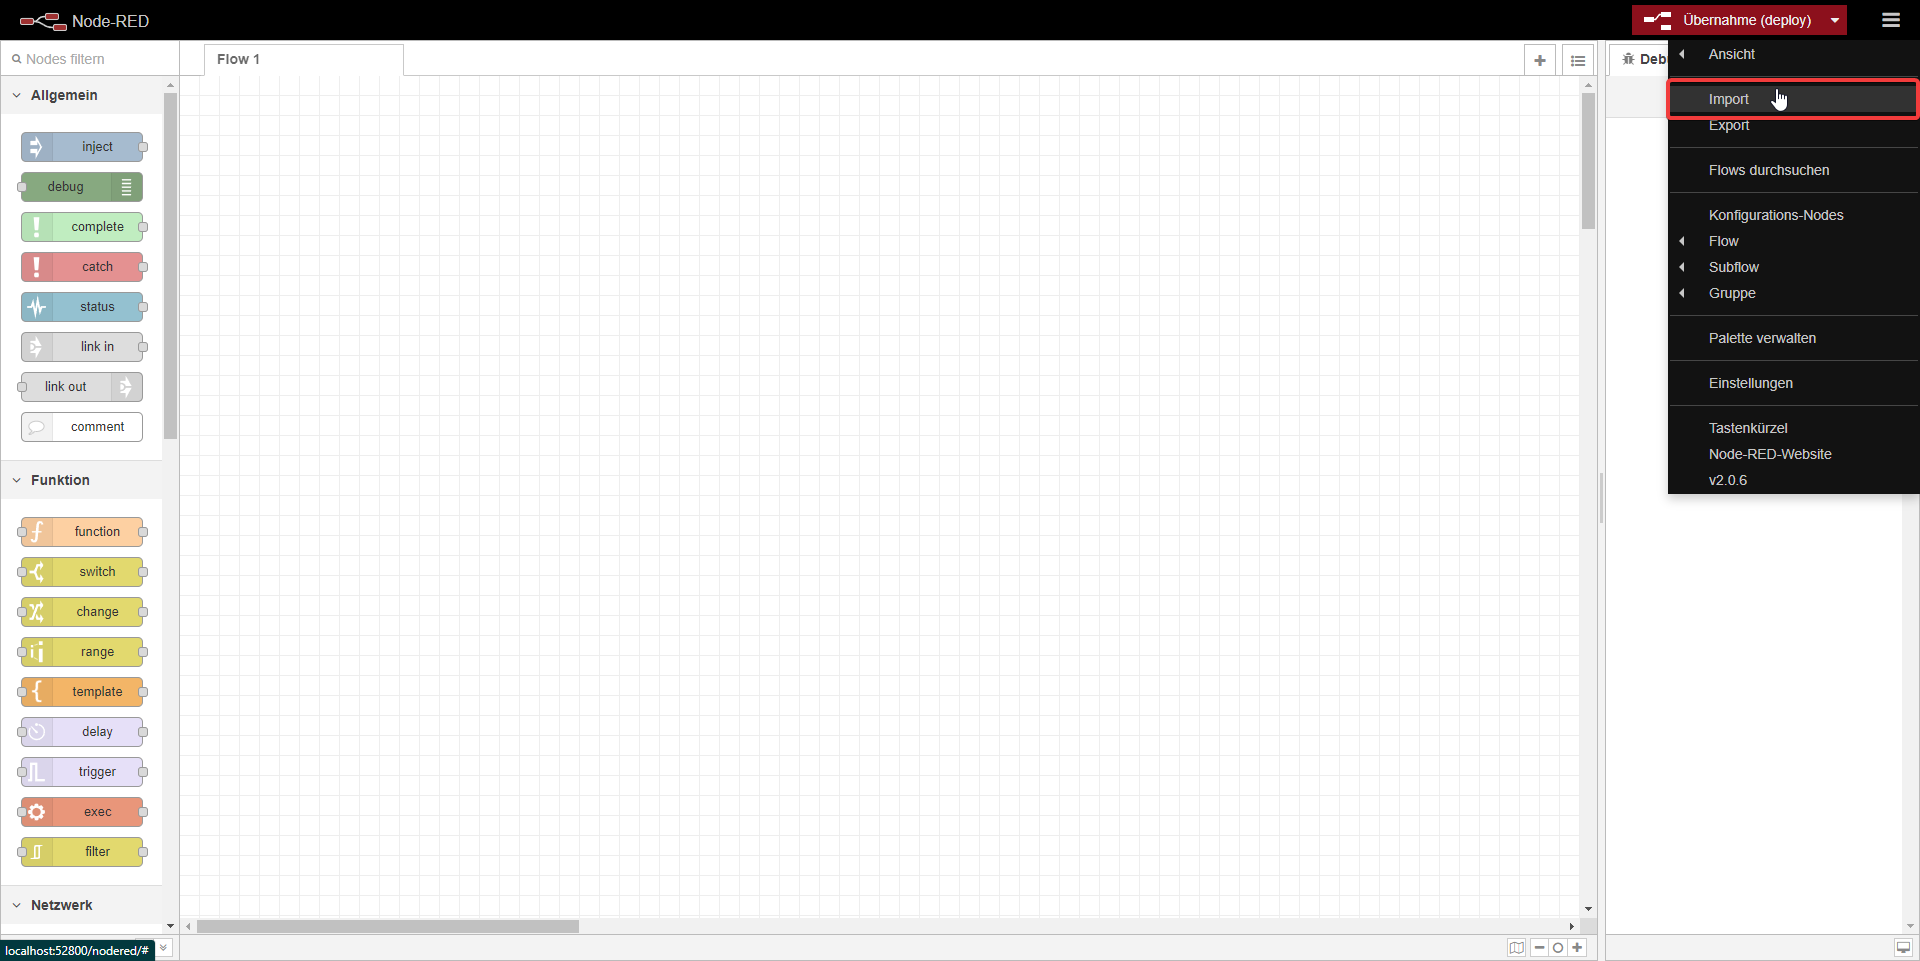
Once you are in the web interface, click on the three lines in the upper right corner and select Import.
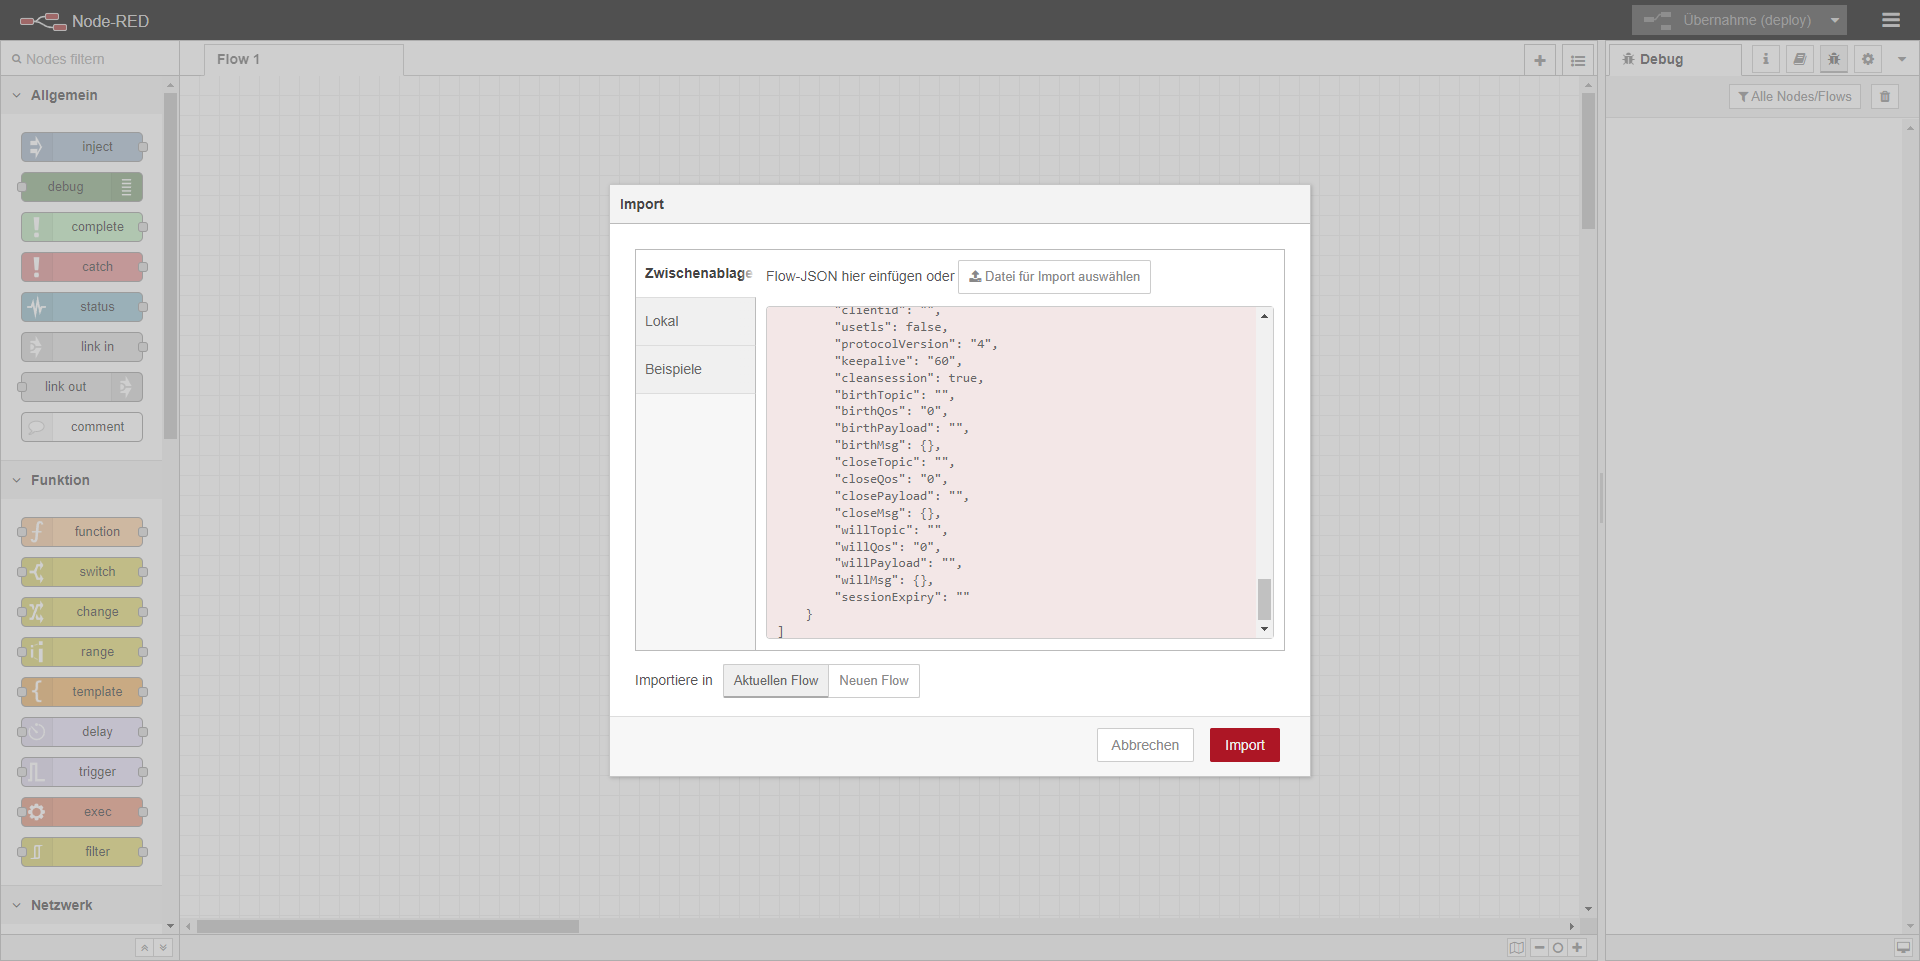
Now copy this json file and paste it into the import field. Then press Import.
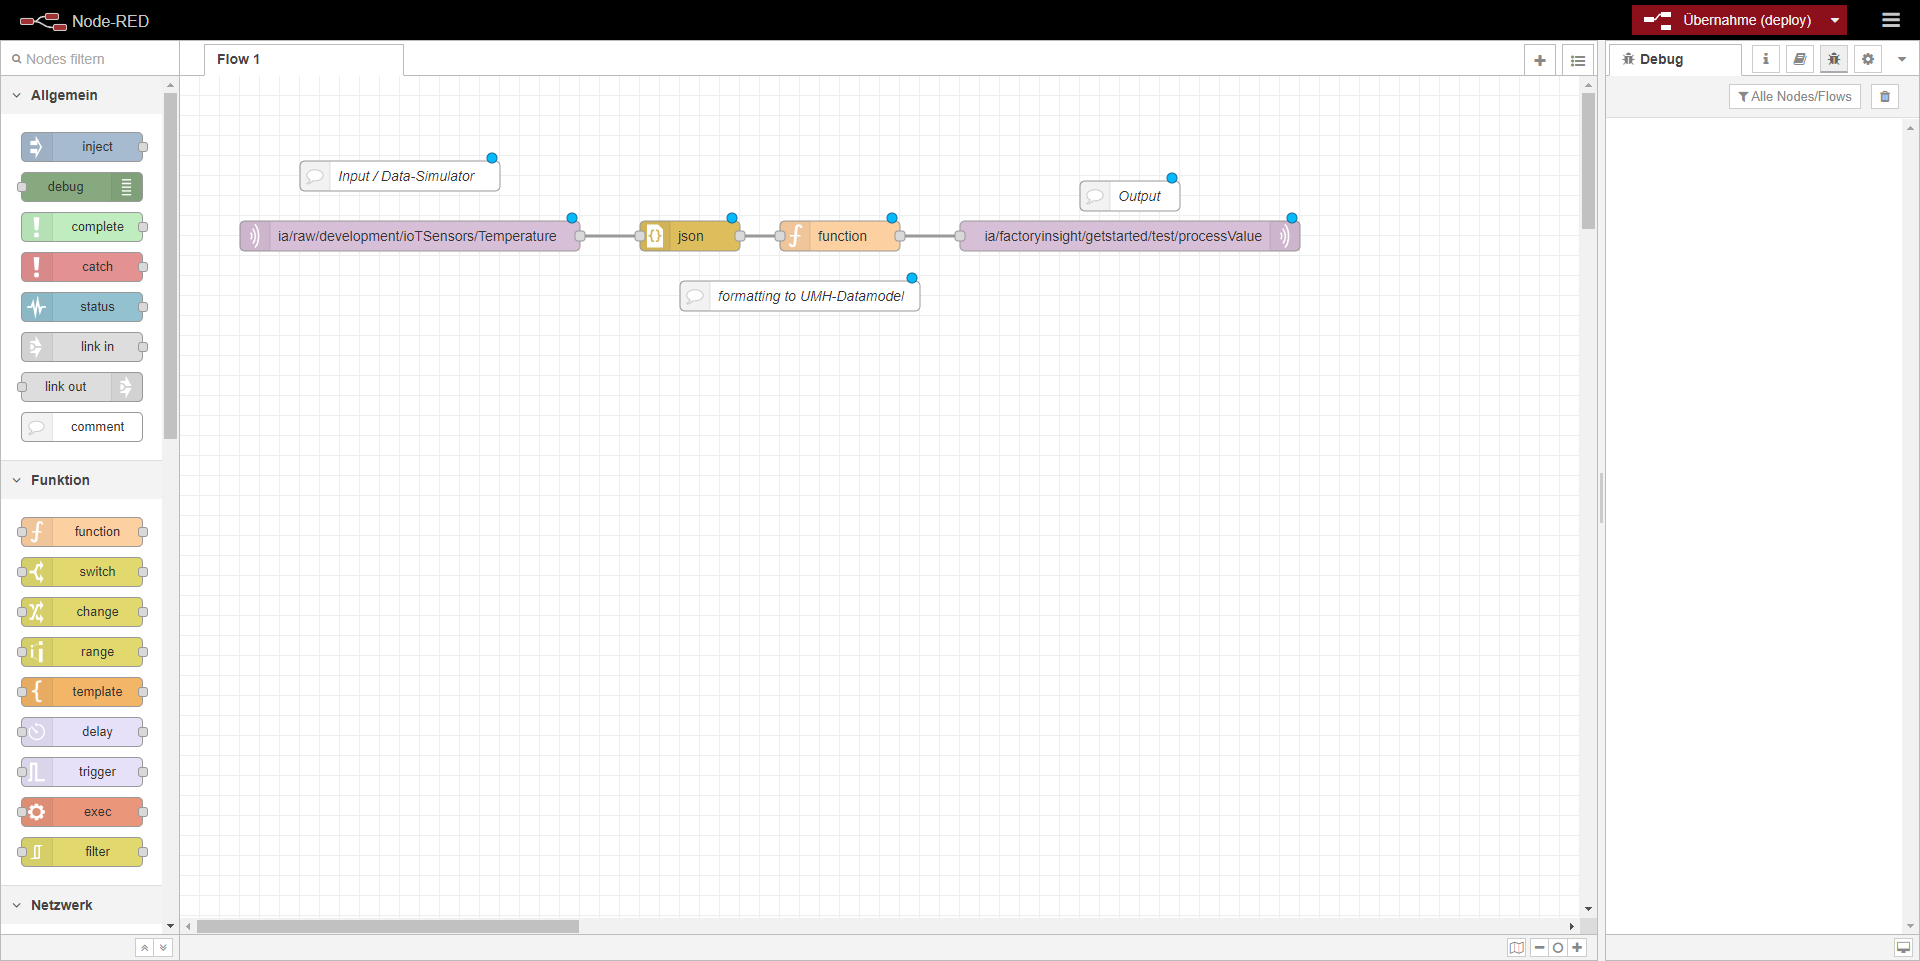
Node-RED is a tool, to manage and connect data flows. Simply said, you can specify what data is processed how and then send where.
Each flow starts with an input node, where you can specify the data source. In this case, the data source is a simulated temperature sensor, the data is conveyed via the MQTT microservice. After the json node, which is used to parse the data, it is then passed to a function node, where you can manipulate the data, for example add a timestamp or format it to the correct unit. After the manipulation or contextualization, the data is passed on to an output node, where you can specify the destination of the data.
- To activate the imported flow, simply click on the Deploy button located
at the top right of the screen. If everything is working as expected,
you should see green dots above the input and output. Once you have confirmed
that the data is flowing correctly, you can proceed to display it in Grafana.
3. Import flows to Grafana & view dashboard
Go back to the Management Console, close the Node-RED popup and open the Grafana popup. Again, click on the open button, to access the Grafana web interface. To log in, you need the Grafana log in credentials, which you can also find in the Grafana popup.
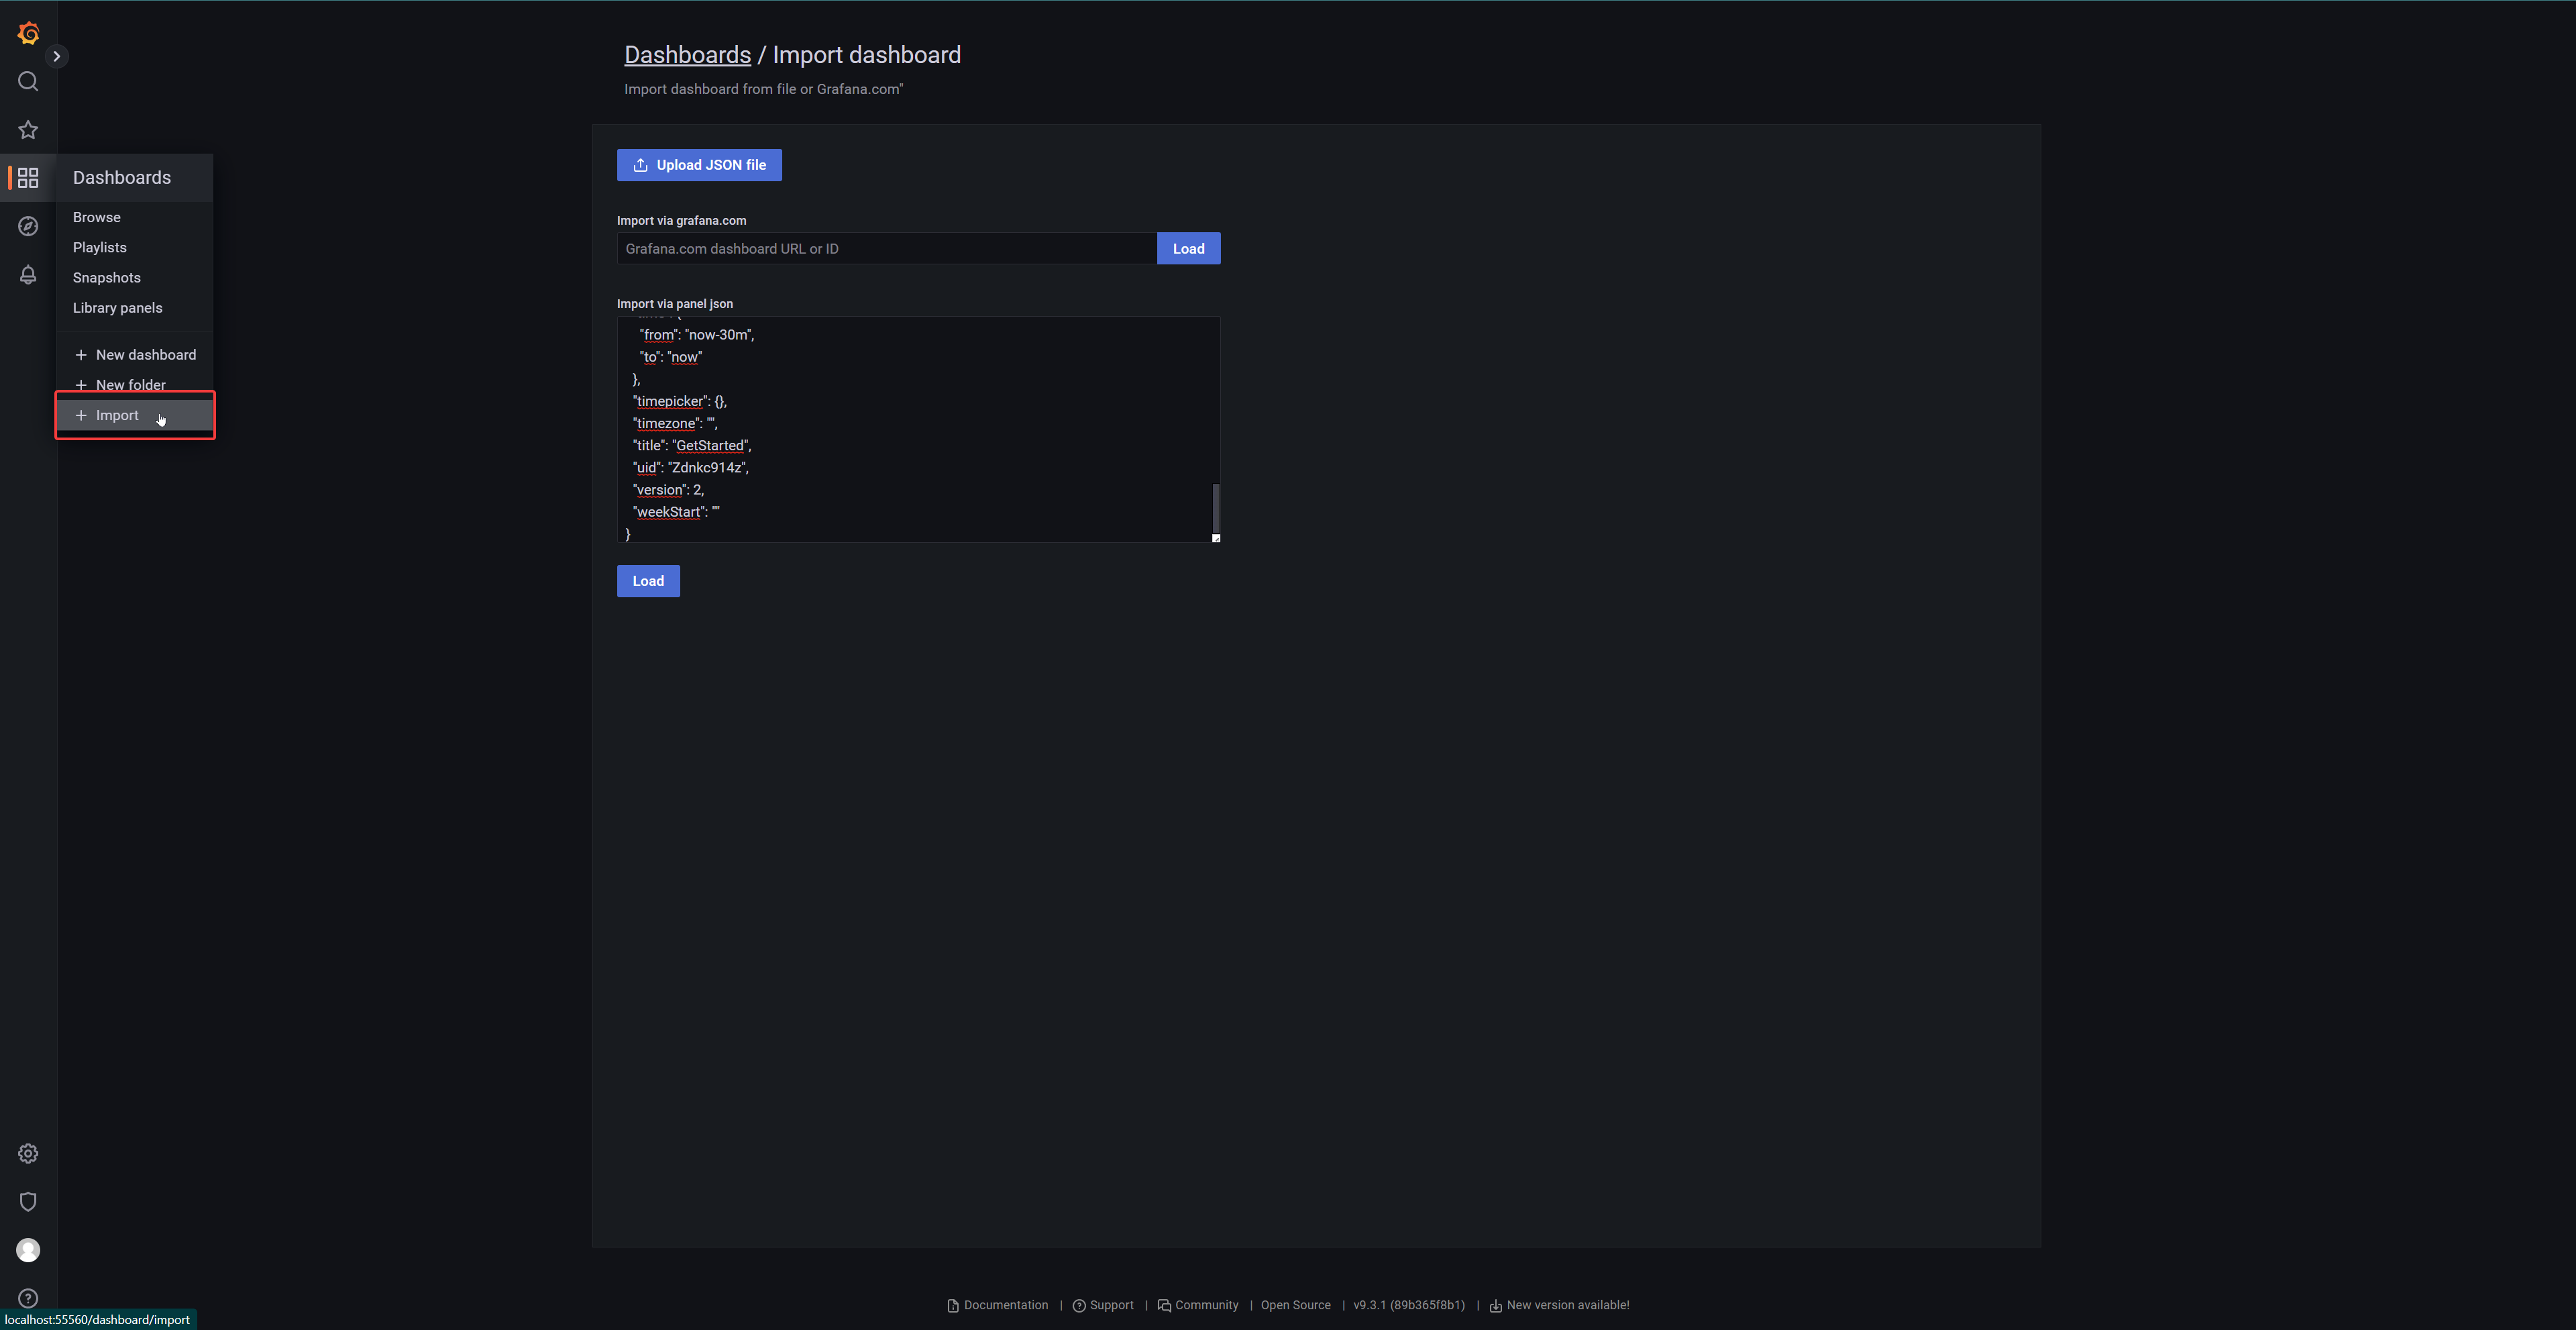
Once you are logged in, click on Dashboards on the left and select Import. Now copy this Grafana json and paste it into Import via panel json. Then click on Load. You will then be redirected to Options where you need to select the umh-v2-datasource. Finally, click on Import.
If everything is working properly, you should now see a functional dashboard with a temperature curve.
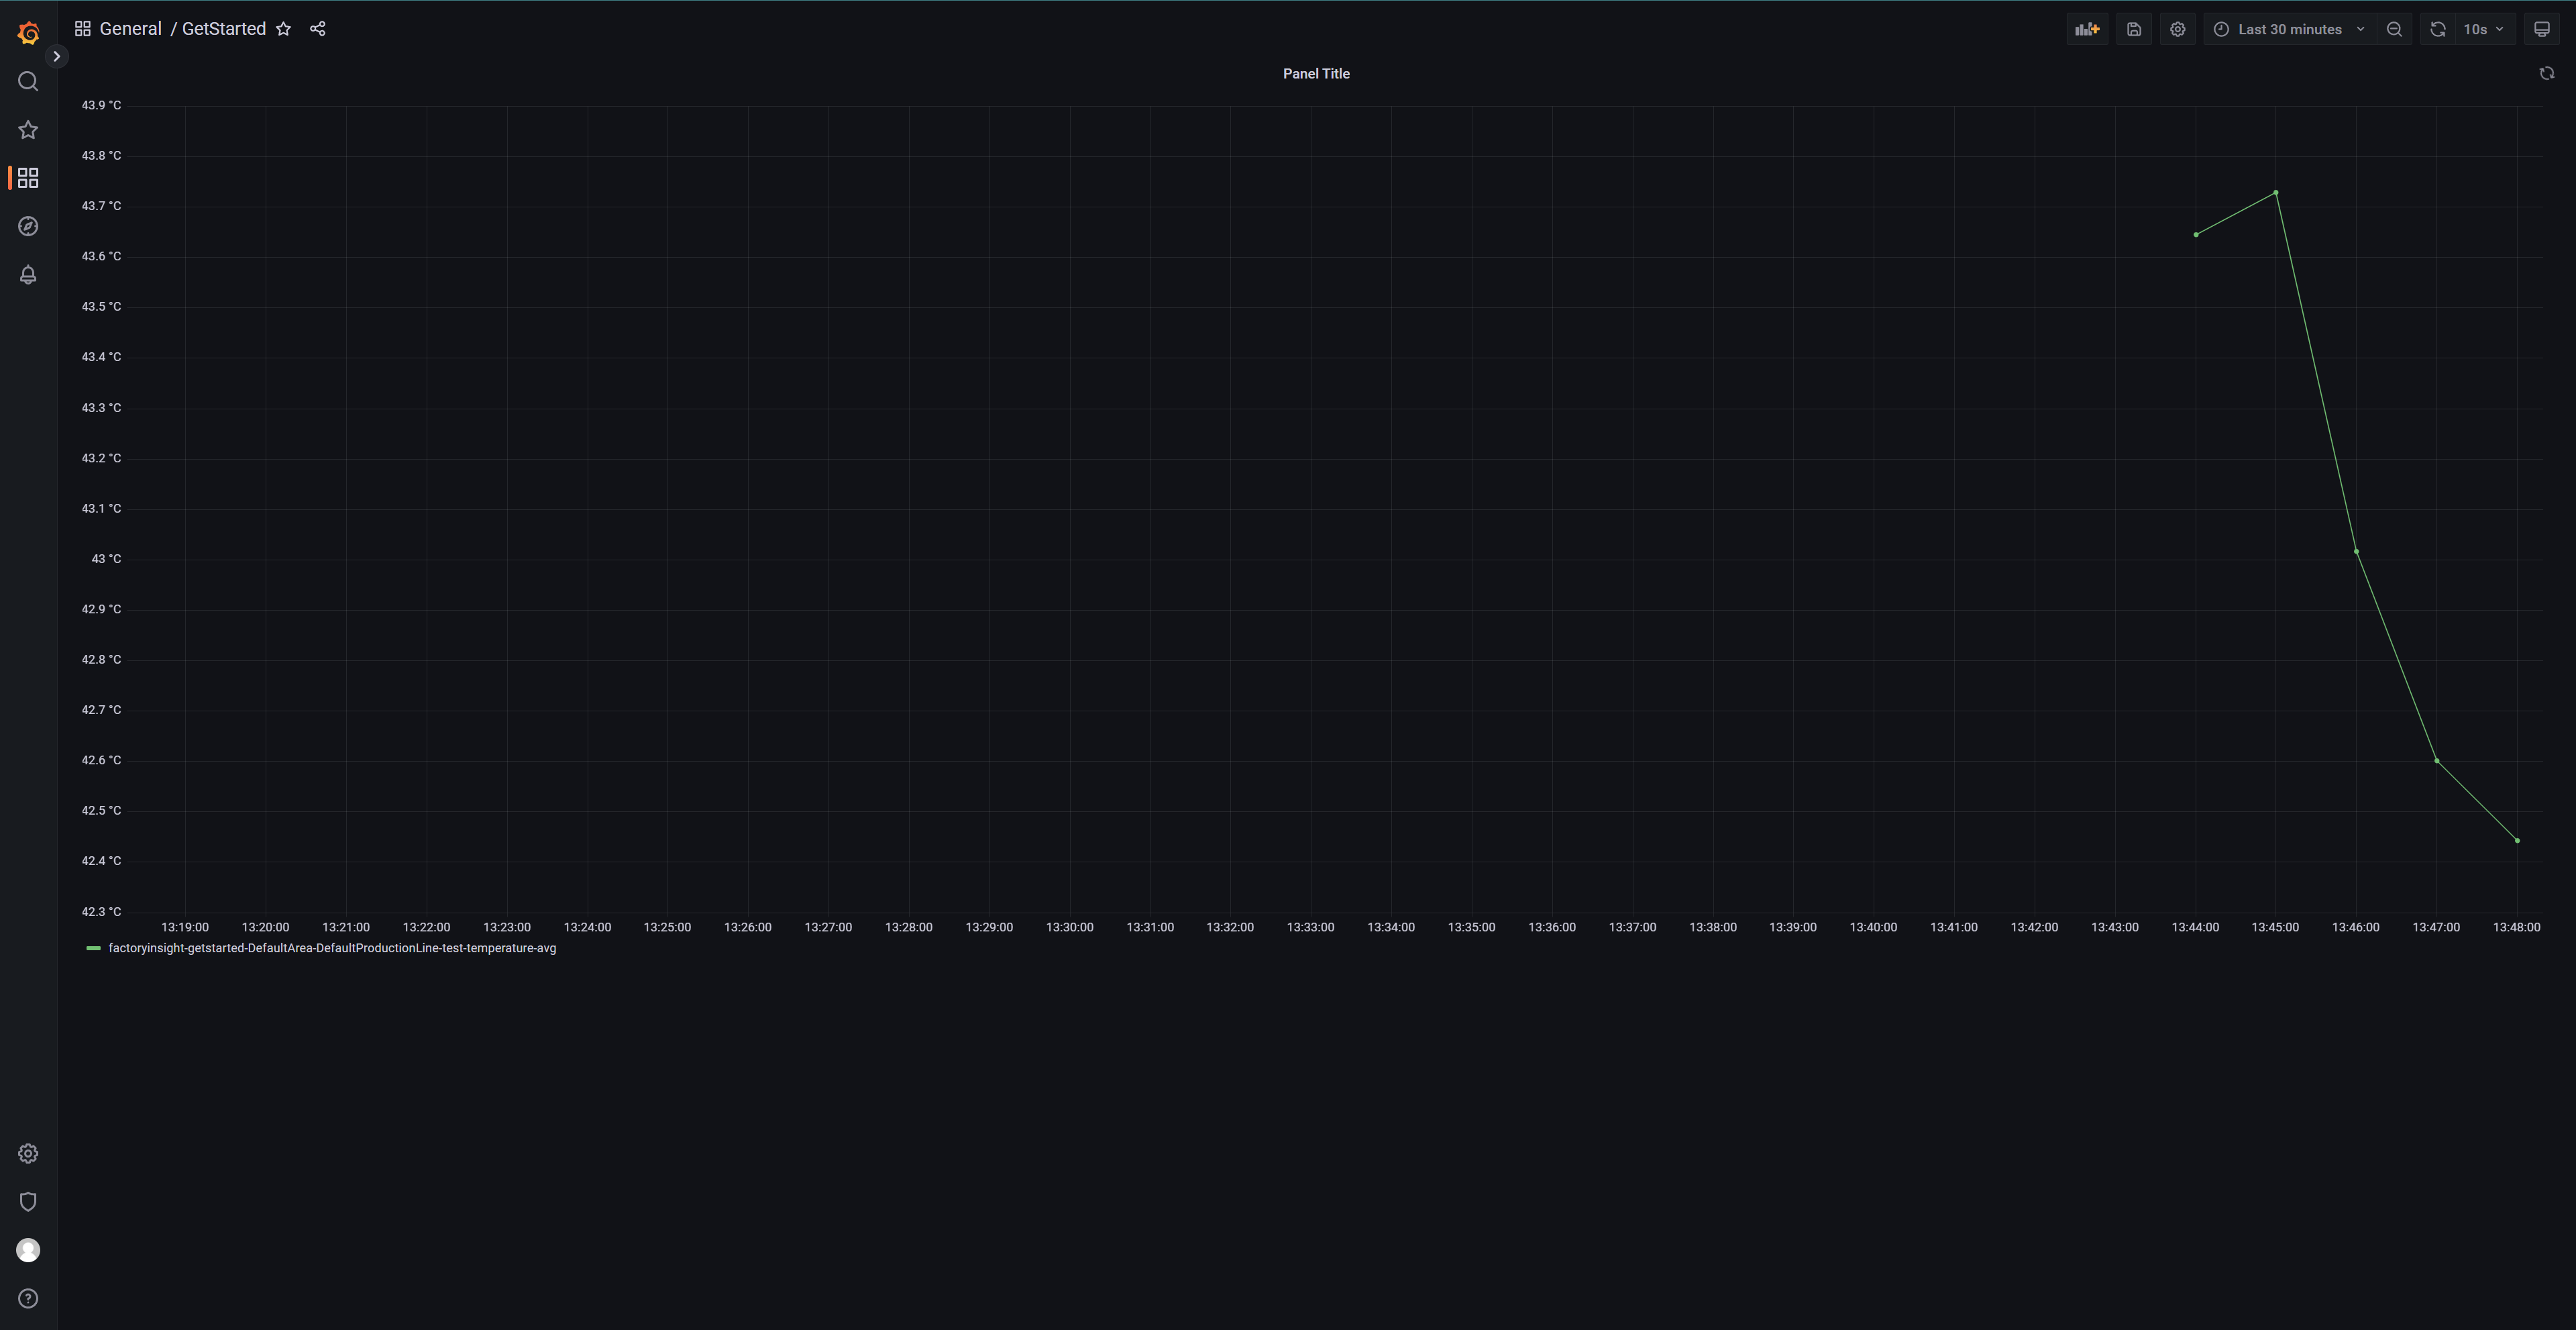
Grafana is a tool, to visualize data. You can create dashboards, which can display a wide range of different graphs and charts.
Grafana is connected to the message broker of the UMH stack and can therefore access all the stored data. Here, the imported dashboard is preset to display the temperature, that was sent by the previously imported Node-RED flow.
What’s next?
Next, you can create a Node-RED flow and learn how to create your own dashboard in Grafana. Click here to proceed. This guide is also linked in the tutorial in the Management Console.